Memory Usage investigation
This page shows how to analyze the memory consumption of a VOLTHA container (written in Go) by using a
custom built image of the container and the pprof tool, provided by the GO Language.
Build an instrumented docker image
If the Makefile and the Helm Charts of your image support building and deploying profiled images (should be the case),
you can create a profiled image, via the make docker-build target adding the option BUILD_PROFILED=true.
The command will generate two images- the normal and the profiled one
Following is an example for the voltha-openonu-adapter-go, please customize the values according to your
docker registry and desired tag:
DOCKER_REGISTRY="hhildebr/" DOCKER_TAG="hh-dev" BUILD_PROFILED=true make docker-build
bbsim@bbsim:~$ docker images
REPOSITORY                          TAG             IMAGE ID      CREATED      SIZE
hhildebr/voltha-openonu-adapter-go  hh-dev-profile  e142bba3afea  2 hours ago  725MB
hhildebr/voltha-openonu-adapter-go  hh-dev          8b6c5436a97d  2 hours ago  37.8MB
Deploy the instrumented image
Now you can deploy VOLTHA by using the custom <image_name>-profile via helm flag.
Also the profiler flag must be activated.
Following is a snippet to put into a values.yaml file.
voltha-adapter-openonu:
 images:
   adapter_open_onu_go:
   repository: hhildebr/voltha-openonu-adapter-go
   tag: hh-dev-profile
   pullPolicy: "Never"
 profiler:
   enabled: true
Verify and expose the profiler endpoint
To verify that the associated profiler server was started successfully and the endpoint is exposed in kubernetes, use the following command:
kubectl get svc --all-namespaces
The expected output is:
NAMESPACE   NAME                                   TYPE      CLUSTER-IP EXTERNAL-IP PORT(S)  AGE
…
voltha      voltha-voltha-adapter-openonu-profiler ClusterIP None       <none>      6060/TCP 2h
…
To then be able to communicate with the profile server from your host system, you have to configure an appropriate port forwarding. An example is the following:
kubectl -n voltha port-forward --address 0.0.0.0 svc/voltha1-voltha-adapter-openonu-profiler 6060:6060
Use the pprof tool
Static Mode
The profiling tool can be now interacted with and data retrieved. Following is an example of how to get the heap usage of the container and save it to a file:
curl http://127.0.0.1:6060/debug/pprof/heap > onu-go-heap.pprof
To get a first idea of the system’s status, a graphical overview of the heap usage can be created from the extracted
data using the pprof tool and displayed in the browser.
go tool pprof -http=:8080 onu-go-heap.pprof
In order to save the graphical representation of the data permanently, an image file can be created from it (PDF-format is also supported):
go tool pprof -png onu-go-heap.pprof
Following is an example with heap data collected after hundreds of cycles of startup and deletion of multiple BBSIM ONUs. The individual objects/functions can be seen there in relation to each other. Already by the size of the boxes you can recognize the objects/functions where to find the memory leaks.
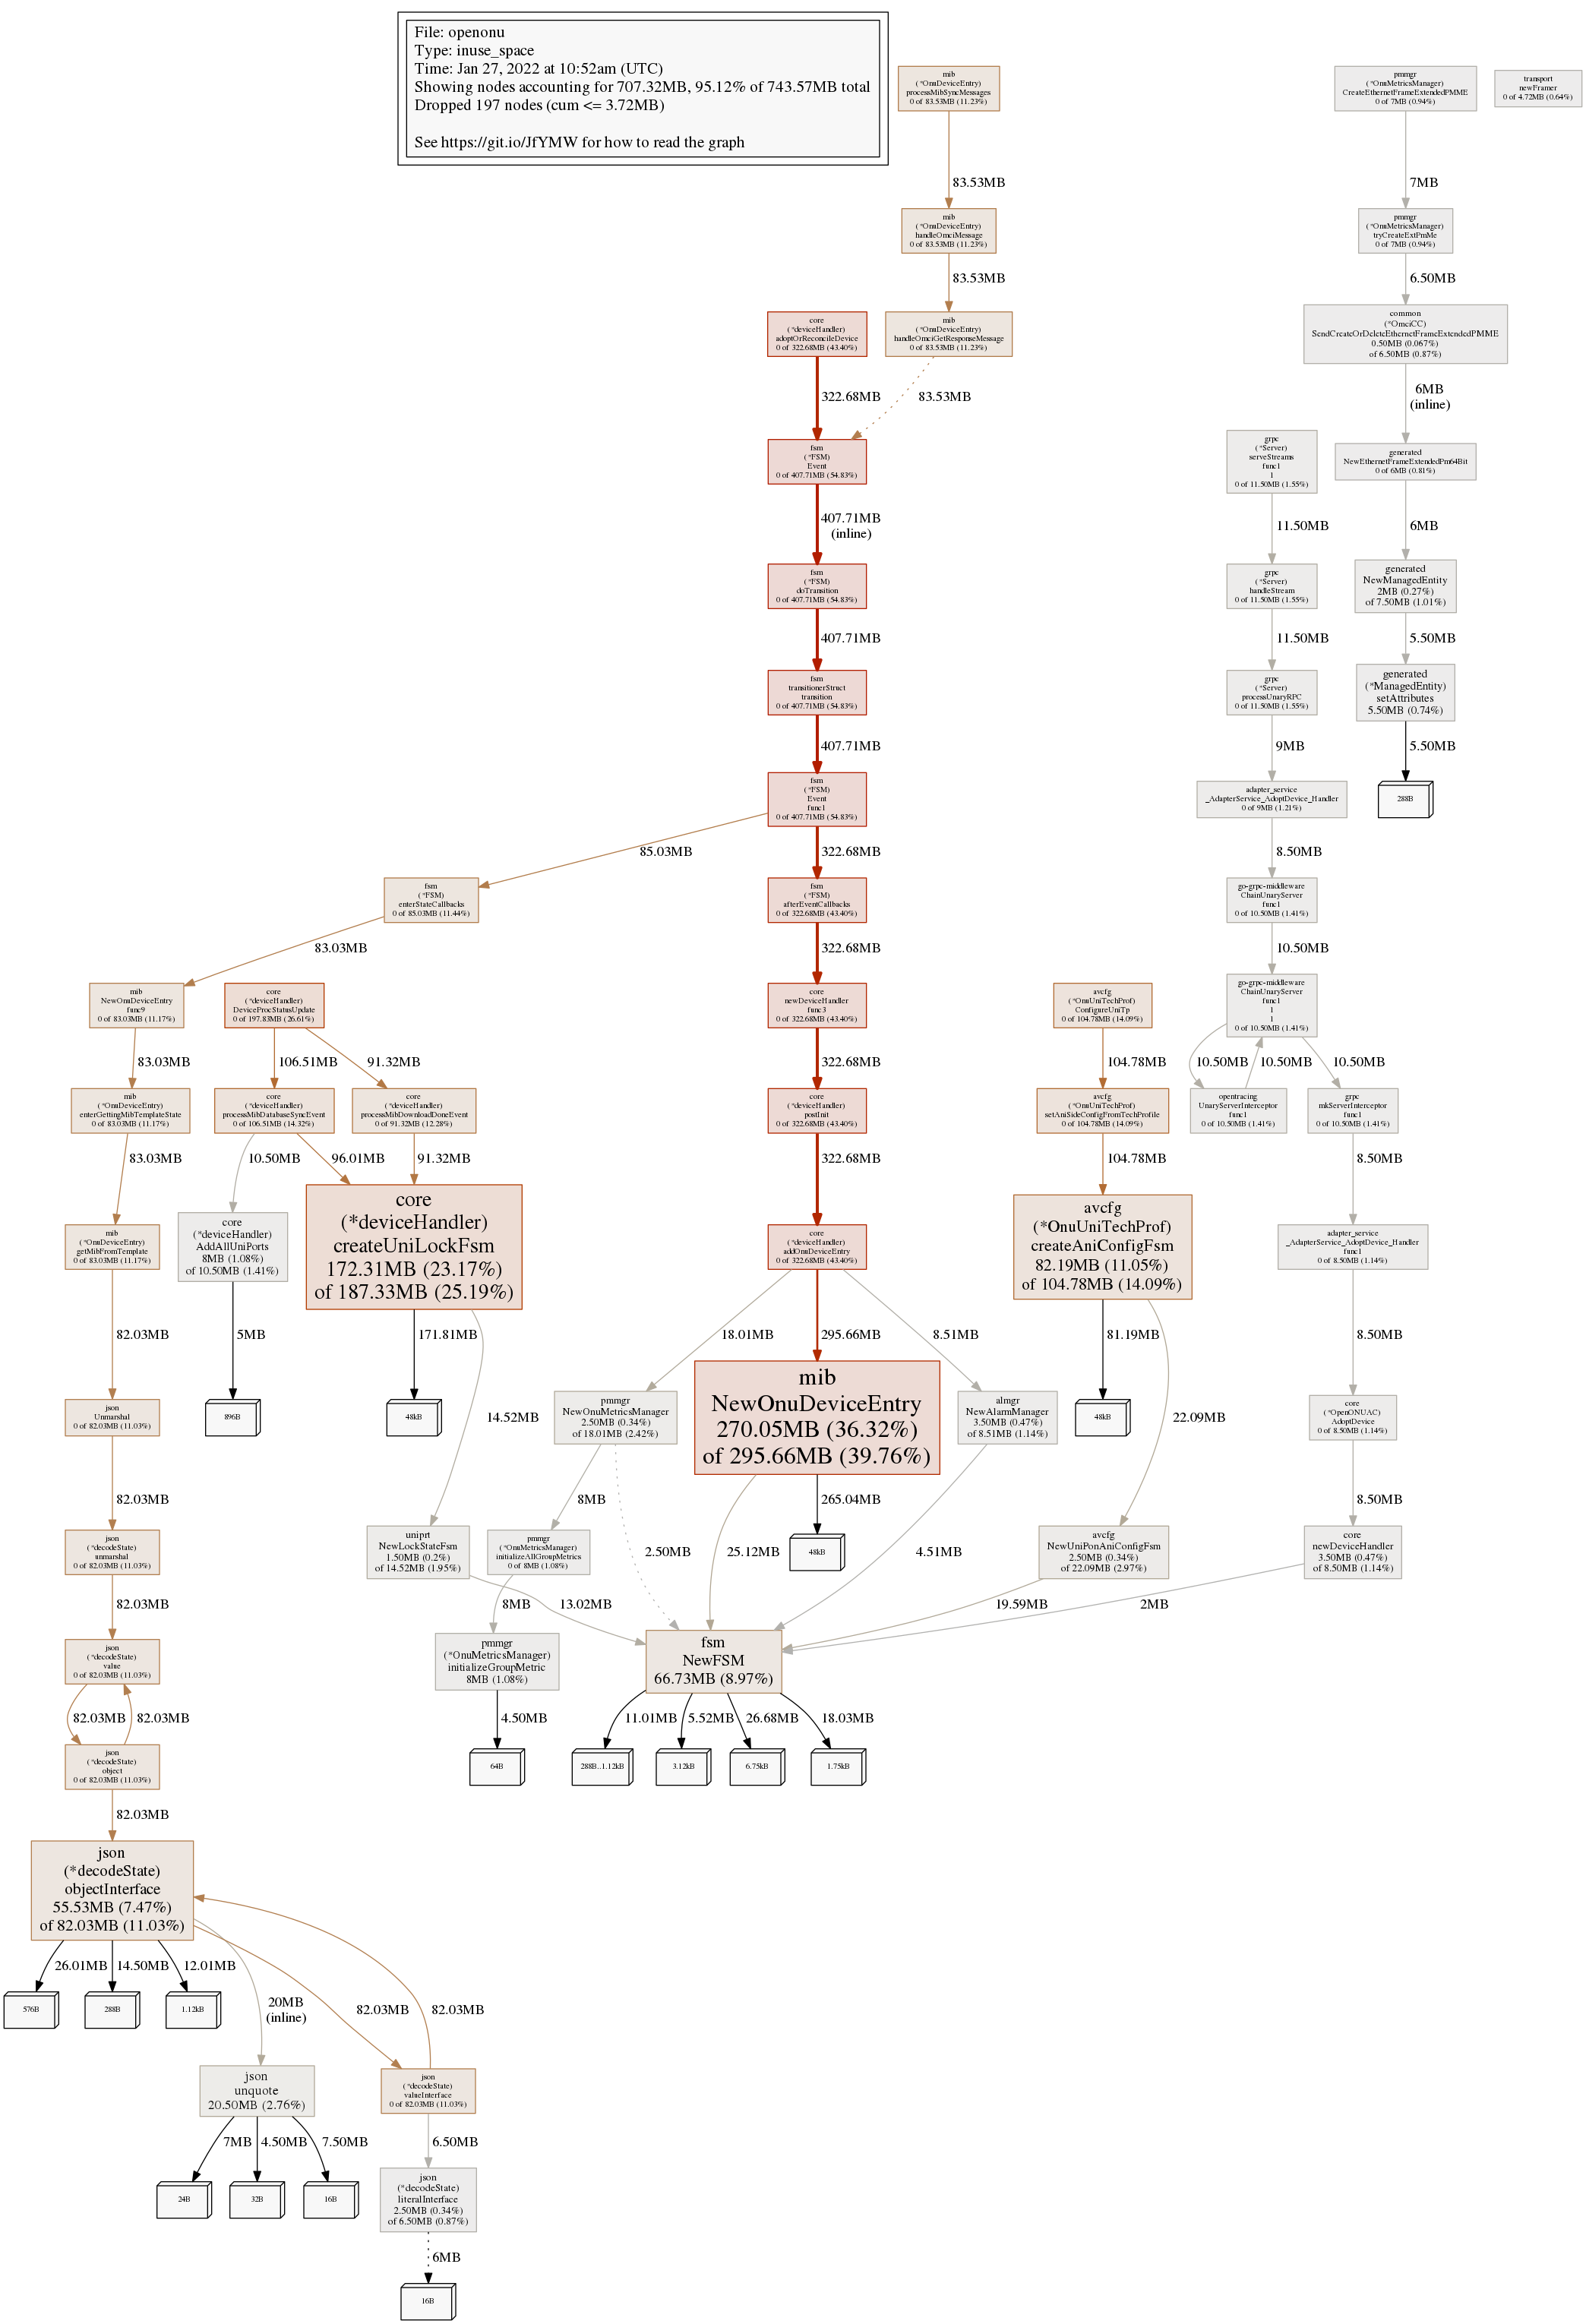
Graphical representation of memory usage
Interactive Mode
To start a detailed investigation, pprof is invoked in interactive mode.
Since pprof assumes by default that the code belonging to the UUT can be found in the /go/src directory,
this path part must be removed using the trim_path option and replaced with the actual directory part using
the source_path option.
Following is an example for the openonu adapter:
go tool pprof -source_path /home/bbsim/temp_pperf/voltha-openonu-adapter-go -trim_path /go/src /mnt/shared/onu-go-heap.pprof
by using the top command one can see which are the main originators of memory leaks,
observing the the first ten objects/functions displayed:
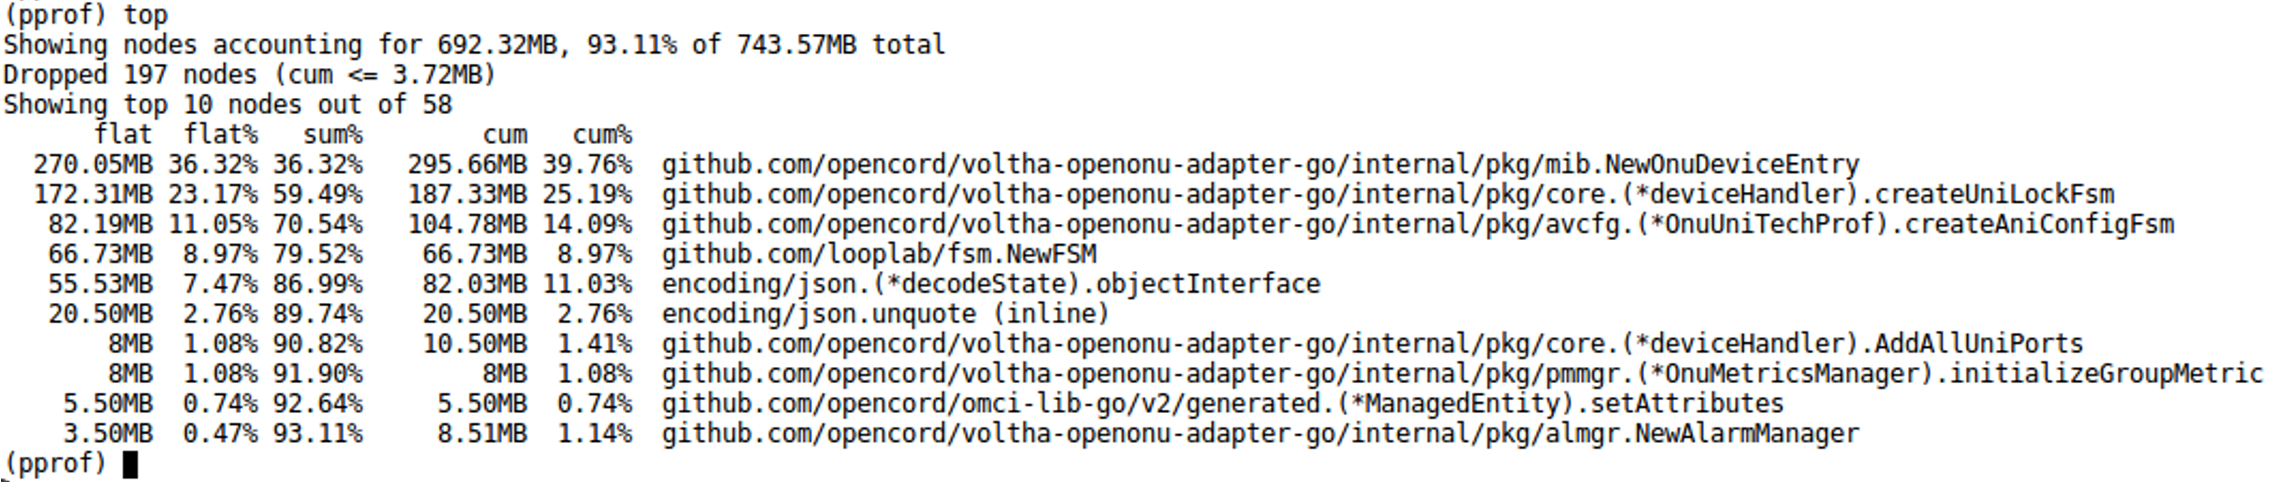
Ten highest memory functions
If more object/functions are to be displayed, simply add the desired number to the command - e.g. top100.
The next step is to use the list <function_name> command to view the detailed memory allocations.
Example Memory leak analysis and fix
Following is an example applied for the number one of the top10, function NewOnuDeviceEntry.
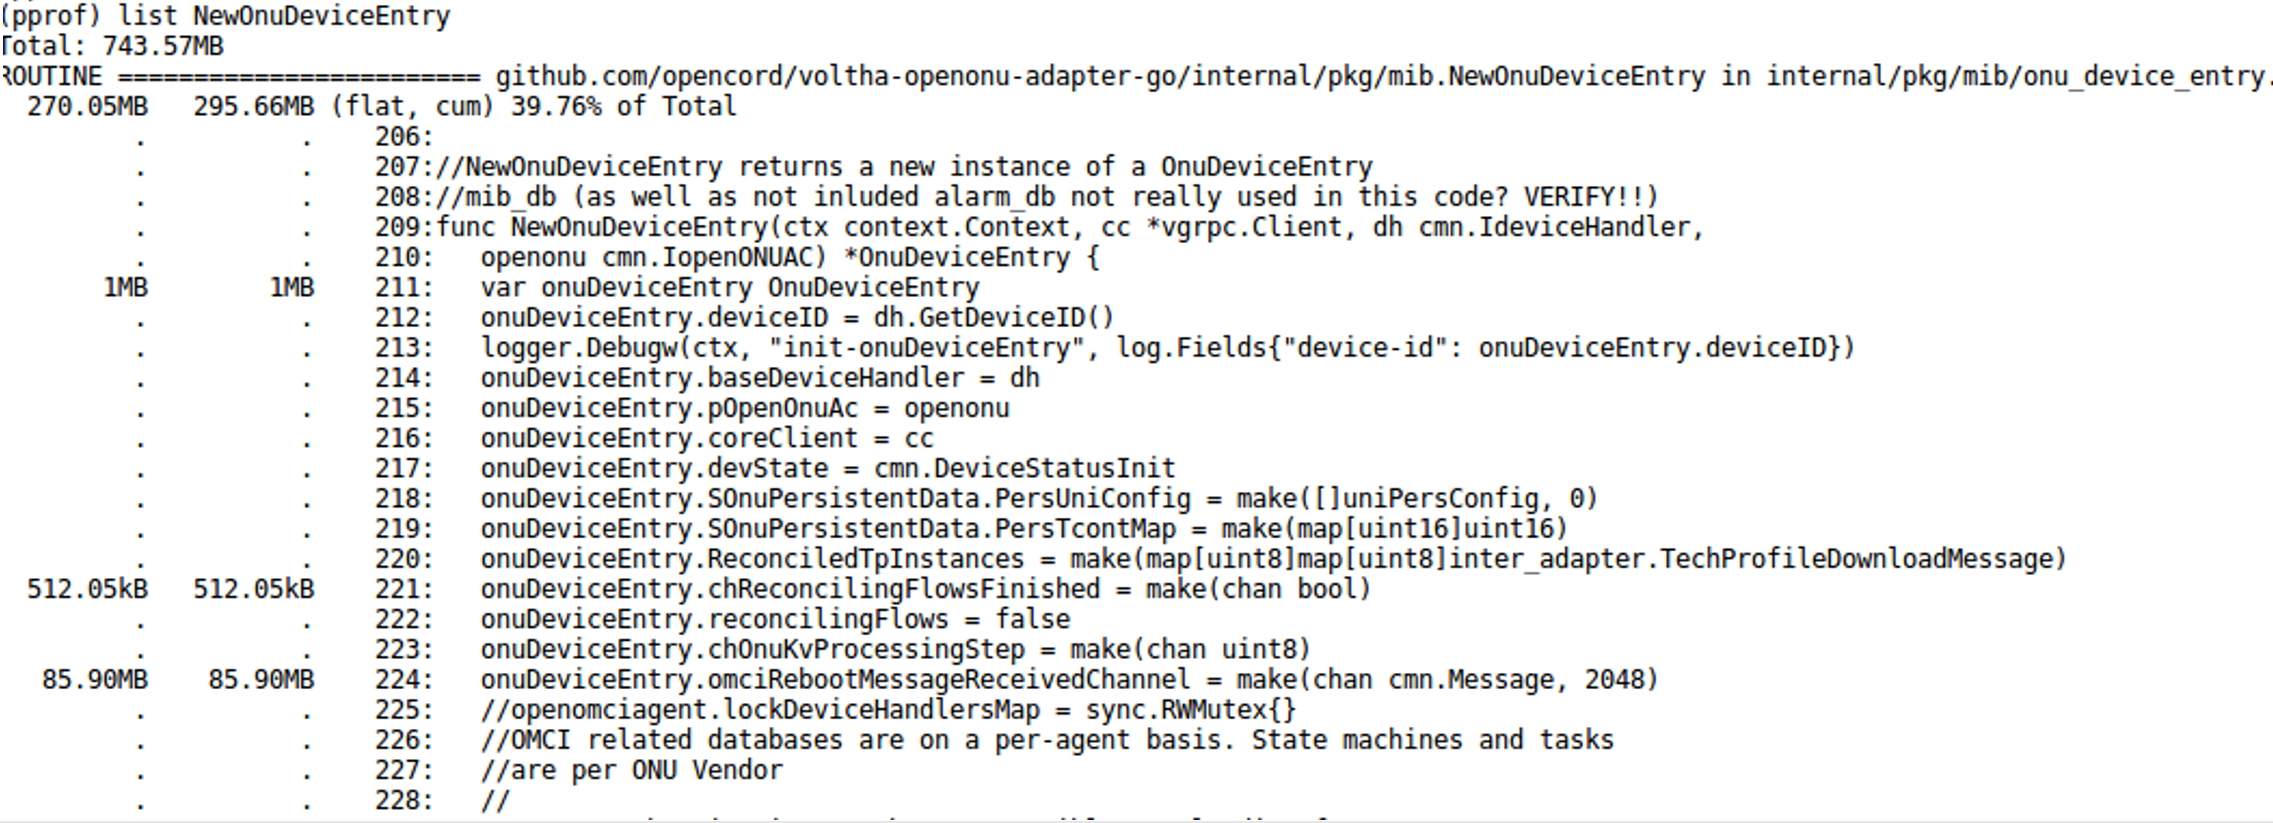
List function details before optimization
Since the single allocation of onuDeviceEntry.omciRebootMessageReceivedChannel should occupy at most 100kB of
heap memory (2048 standard OMCI messages), we can conclude that the 85.90MB of occupied memory represents more
than 850 instances of onuDeviceEntry not deleted by the GC.
After removing the cause of the memory leak the same test with hundreds of cycles of startup and deletion of multiple BBSIM ONUs shows that the issue has been solved. Having a look at the retrieved pprof data shows a significant decrease of memory consumption, about 10MB vs 744MB without the patch:
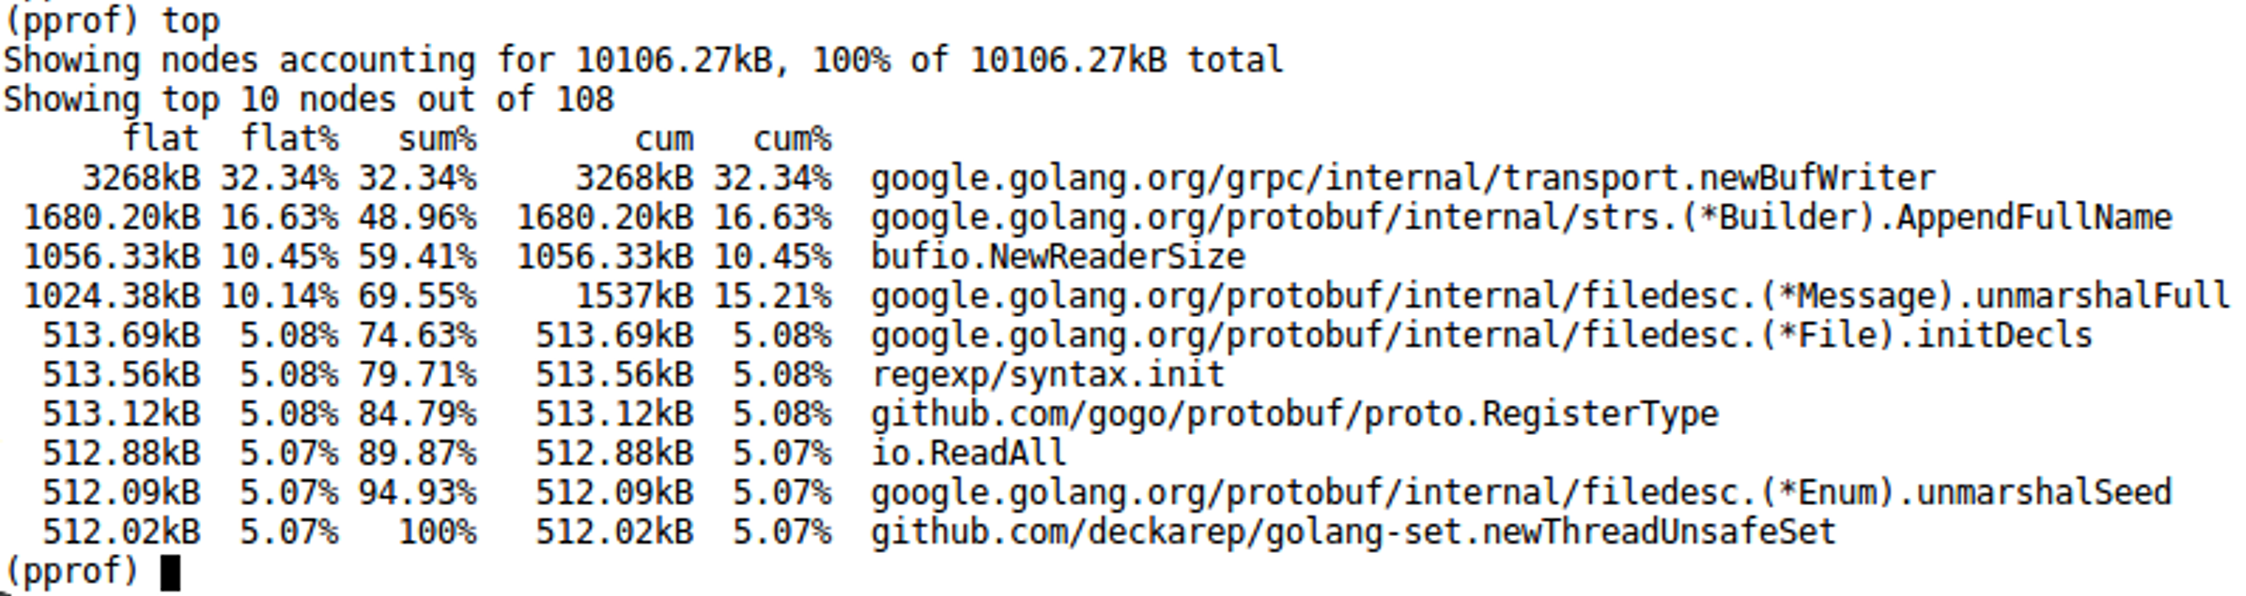
List function details after optimization